How to split a column in SQL Server
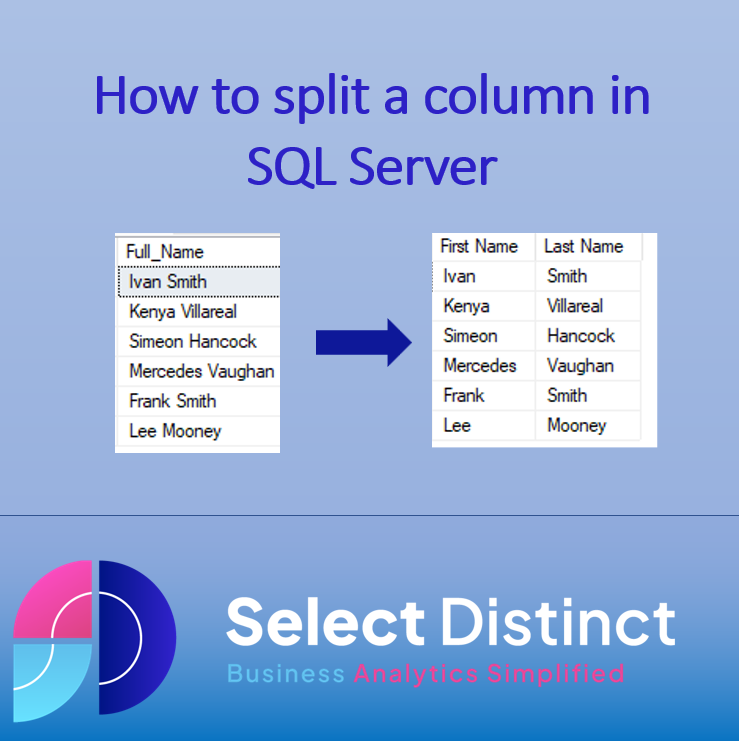
This quick guide shows you how to split a column in SQL Server This can be a very common problem, but with a few commands it is easily achieved The guide shows you step by step how to split one column into multiple columns in SQL Server. You can copy the code and work through […]
How to use Transpose in Excel
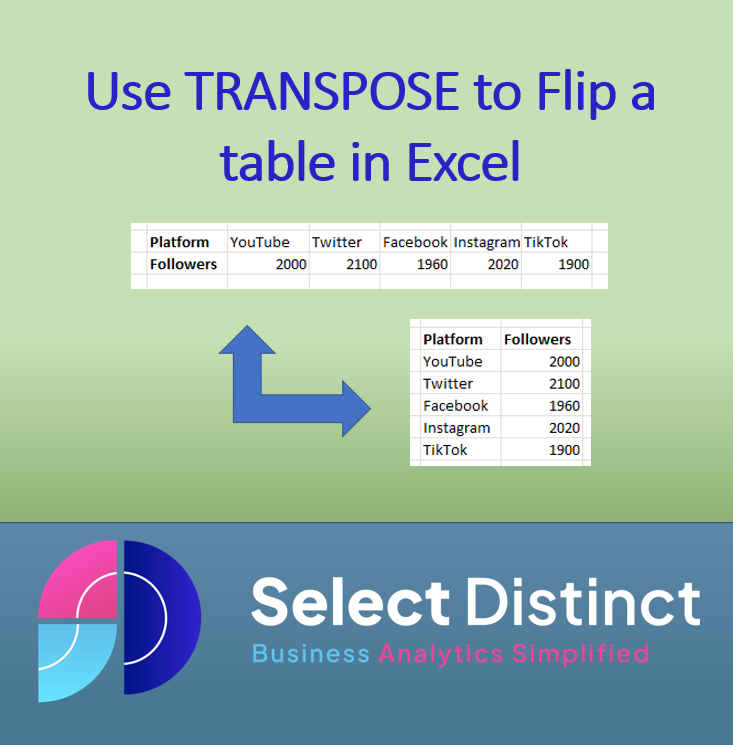
What is the TRANSPOSE function in Excel The TRANSPOSE function in Excel enables users to easily switch between vertical and horizontal ranges of cells. It is used to rearrange data so that it can be more efficiently read and analysed. With its versatility, the function assists with quickly converting two-dimensional cell ranges without having to […]
Sparklines in Power BI
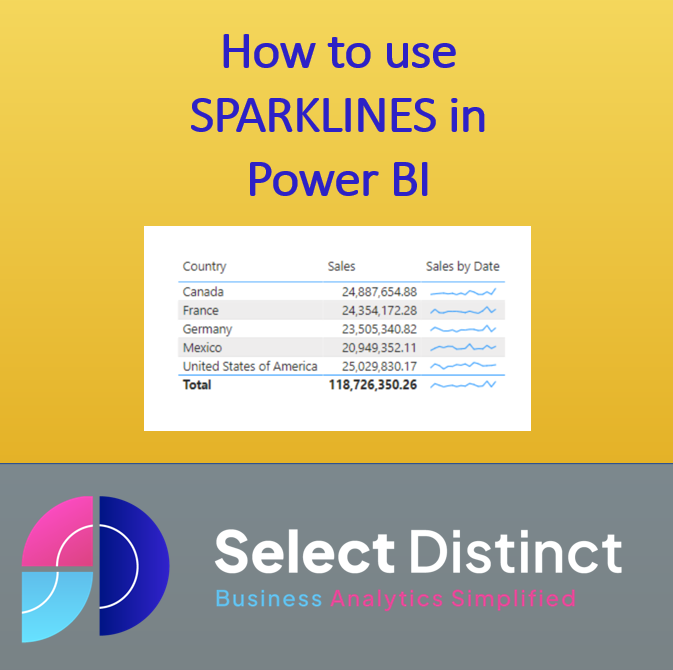
This short guide to sparklines in Power BI tells you what they are, how they can be very useful and how to add sparklines to your power BI reports What are Sparklines? Sparklines are a very compact, space efficient way to show a trend behind a headline number. This tells you whether to investigate […]
The Select Distinct Statement in SQL
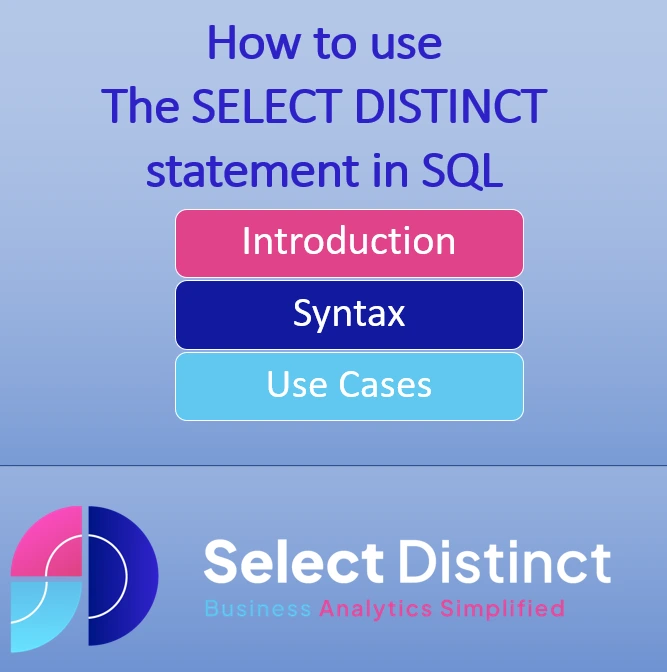
One of the most useful functions in SQL is the SELECT DISTINCT statement *The SQL function which inspired our company name Introduction to the SELECT DISTINCT statement in SQL The SELECT DISTINCT statement is used to return only unique values from a table. Inside a table, a column often contains many duplicate values, and sometimes […]
How to use Power Pivot in Excel
Part 2 – Excel Power Pivot How to use Power Pivot in Excel for data modelling and analysis This follows on from our previous post How to use Power Query What is Power Pivot in Excel Power Pivot is a cutting-edge data modelling technology, It empowers you to create data models, establish relationships, and perform […]
Power BI RELATED Function
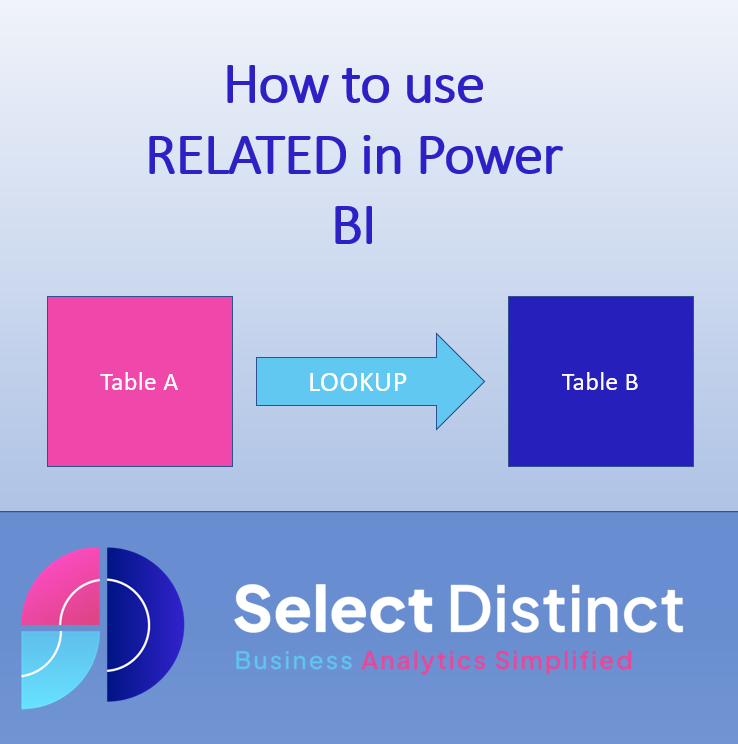
What is the Power BI RELATED function The Power BI RELATED function is a powerful tool that allows users to quickly and easily access related data from a related table It is similar in many ways to using lookups in Excel (VLOOKUP), Excel users wanting to learn this function will find the syntax fairly intuitive […]
Double and Triple-Click in SQL Server
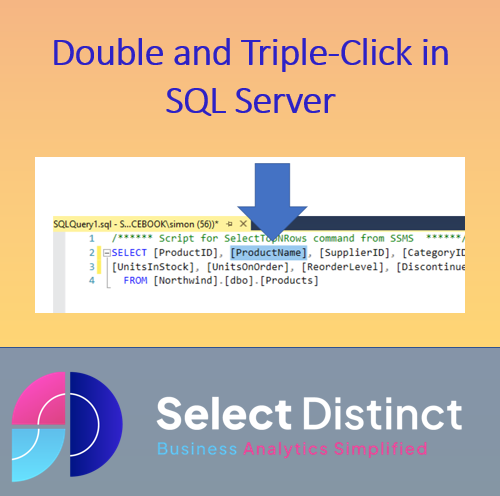
Double and Triple-Click in SQL Server are two very useful shortcuts to save you time and reduce errors This is one of the simplest and possibly most frequent timesavers we use in SQL Server Using Double-Click in SQL Double click is a SQL server shortcut that can save you time and effort when writing SQL […]
Show Values in Rows in Power BI
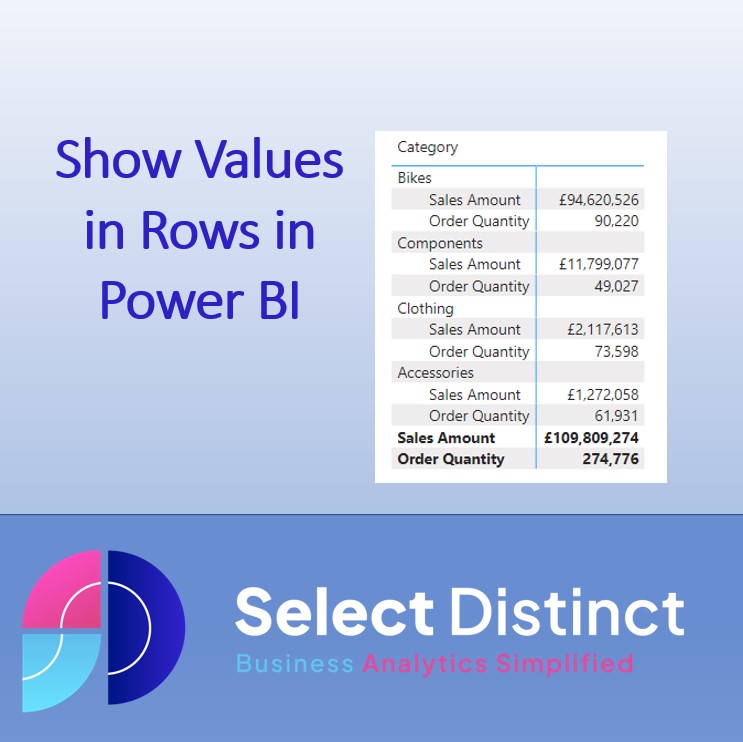
This quick guide shows you how to show values in rows in the matrix visual in Power BI You will learn how to switch values on show in rows in a matrix, like this example The Matrix visual in Power BI is similar to a Pivot Table in Excel, but not quite as intuitive, which […]
LEAD and LAG Functions in SQL
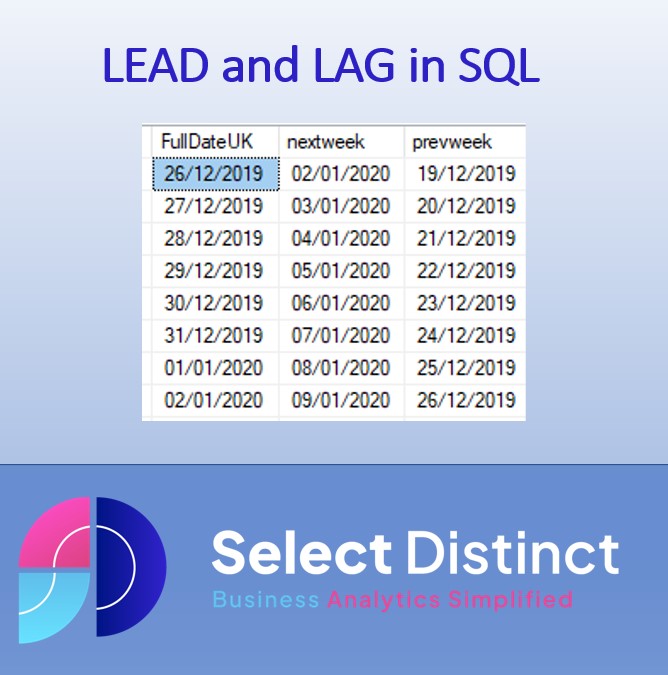
A Guide to Lead and Lag Functions in SQL Introduction: An Overview of Lead & Lag Functions and Their Benefits in SQL Lead and Lag in SQL are essential functions for data analysis. These window functions allow users to compare and analyse data points between rows in a specified window. By using Lead and Lag […]
GETPIVOTDATA Function in Excel
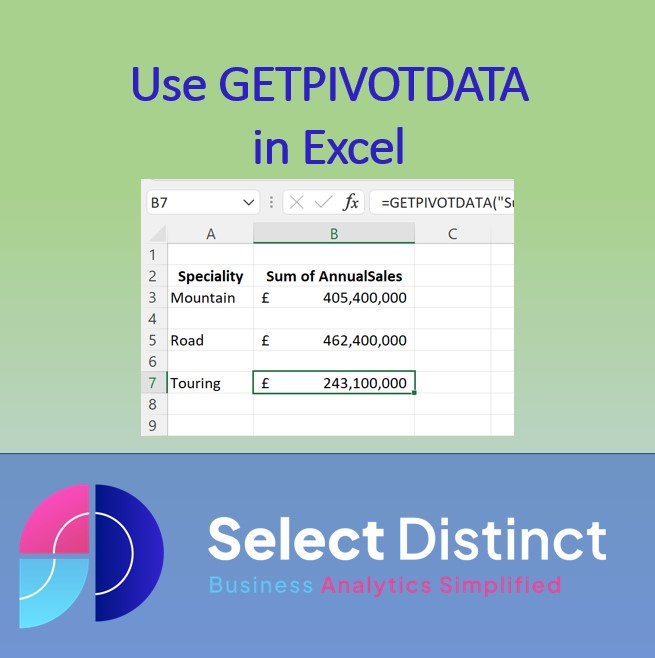
useUsing the GETPIVOTDATA Function in Excel to add flexibility to your Data Analysis & Reporting What is GETPIVOTDATA and How Can It Help You? The GetPivotData function in Excel provides users with the ability to return specific data points from a pivot table, Think of it like a specialised lookup mechanism that can find an […]