A Guide to Extracting Data from Joblogic

Following on from the blog last week,Joblogic Integrations with Power BI – Select Distinct Limited I thought I’d write a similar guide to extracting data from Joblogic. Joblogic is a popular Field Service Management (FSM) software that helps facility management companies run their operations. FSM software is particularly useful for companies that provide services at […]
How to Sync Slicers in Power BI: Step-by-Step Guide
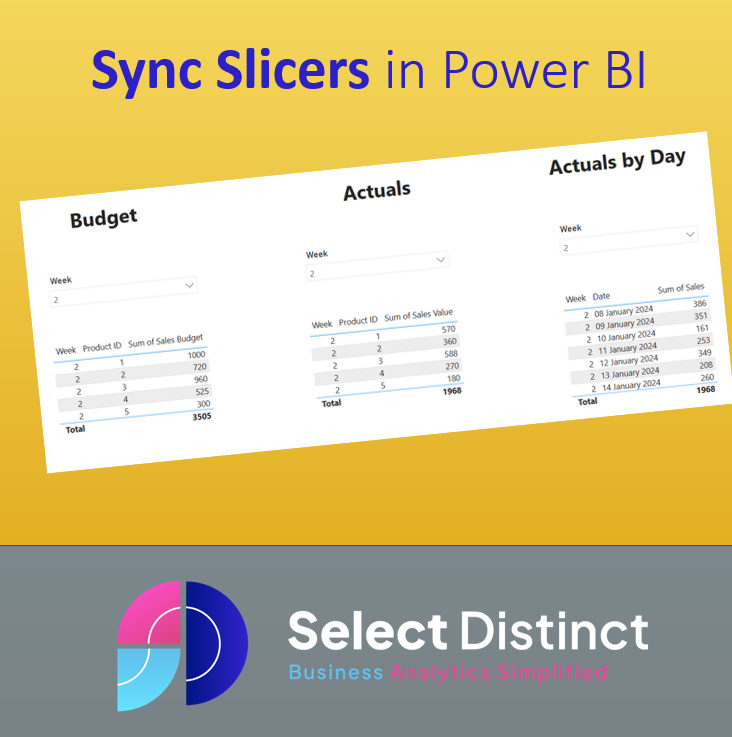
This post explains how to sync slicers in Power BI, without any complex code Slicers are an excellent way to give your users the ability to explore data, allowing users to use the slicers to filter the data down to particular information of interest. But, if your data has different data sets with common values […]
Using Google Search Console Data in Power BI
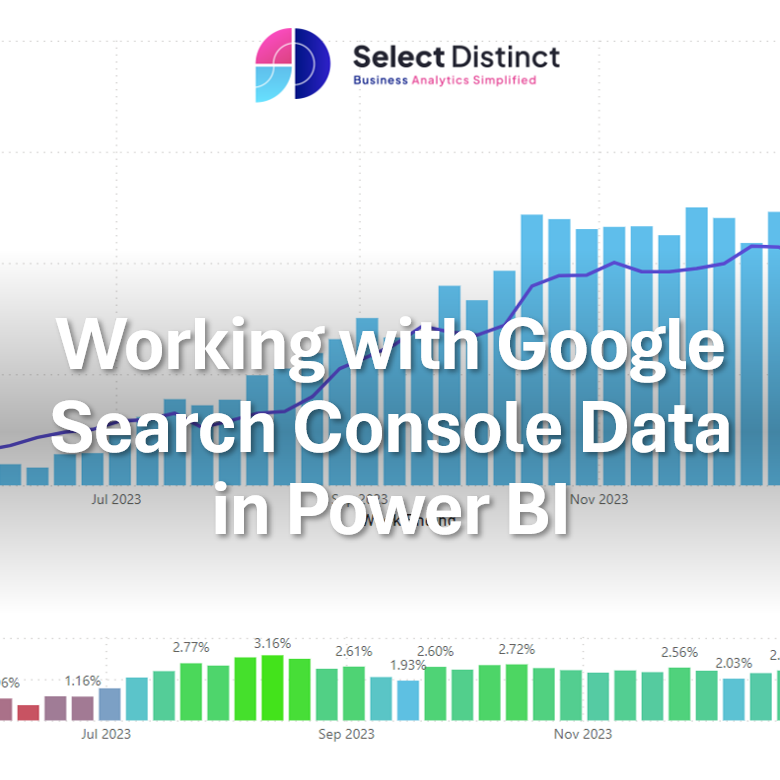
Google Search Console is a very powerful tool to measure SEO performance. This post highlights how with a little effort you can use Google Search Console Data in Power BI to create much more compelling dashboards It tracks a vast amount of really insightful data, but the reporting is limited The example below is the […]
Choosing the Right Paginated Reporting Tool

Pixel-Perfect Precision: In the data realm, the importance of robust reporting tools cannot be overstated. Businesses rely on accurate, timely, and insightful reports to drive strategic decisions, identify trends, and measure performance. In the modern landscape there is lots of focus on interactive visualisation software. However what are the options the distribution and delivering of […]
Navigating Power BI Data Alerts

Introduction Whilst reporting is a key component of any business, how do you respond to key changes. How do you ensure actions are generated when the data changes beyond the limits you set. As part of our Business Support Expert Services this can be a really efficient way to set up reports to monitor values […]
What is Microsoft Fabric? A Guide by Select Distinct Limited

Introduction Microsoft Fabric, the unified environment launched in 2023 is now central to Microsoft’s data strategy. What is the Microsoft Fabric Offering? Who are Microsoft’s competition to this software? What other unified environments are available. This blog aims to demystify some of these areas. What is the Microsoft Fabric Offering? Microsoft Fabric brings together multiple […]
Top Power BI Tips for 2023
Here are our top Power BI tips for 2023 Highlighting our top 5 Power BI tips for 2023 based on popularity Our most popular Power BI tip this year Show values in Rows in Power BI How to show values in rows in the matrix visual in Power BI. a step-by-step guide to change […]
Calculated Columns and Measures in Power BI
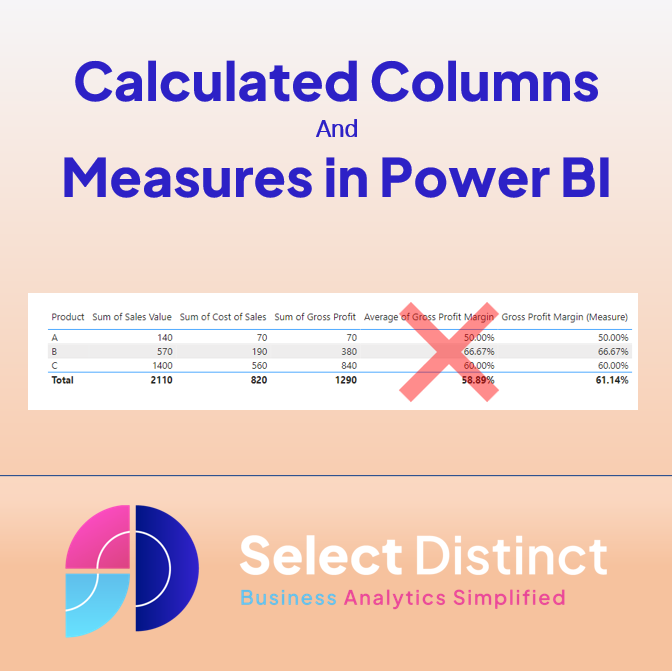
Introduction to Calculated Columns and Measures in Power BI A guide to understanding the differences between calculated columns and measures in DAX for Power BI What is a calculated column? A calculated column is a static value added to a table, calculated row by row when you load the data. What is a measure? A […]
Joblogic Integrations Dashboard with Power BI
Introduction This post outlines our recent approach to a Joblogic Integrations Dashboard with Power BI for a client. Our client offers engineering maintenance services across the UK. They utilize Joblogic field service management software, an all-encompassing field service management software, for activity monitoring. Field Management Software Field service management software improves efficiency, productivity, and customer […]
Unlock the Power of Geo Data

Geo data, or geospatial data, is data that describes the location and attributes of objects or phenomena on Earth. This data can be used to create maps, analyse spatial patterns and trends, and model the real world. Geo data dashboards can also help organisations gain deeper insights into their customers, markets, operations, and performance. In […]