TOP N in Power BI

Understanding TOP N in Power BI You have heard of the 80:20 rule (Pareto)? In the world of data analysis, having the ability to efficiently rank and prioritize information is crucial. This is where the TOP N function in Power BI comes into play. By utilizing this powerful ranking function, analysts and data professionals can […]
Toggle Measures in Power BI

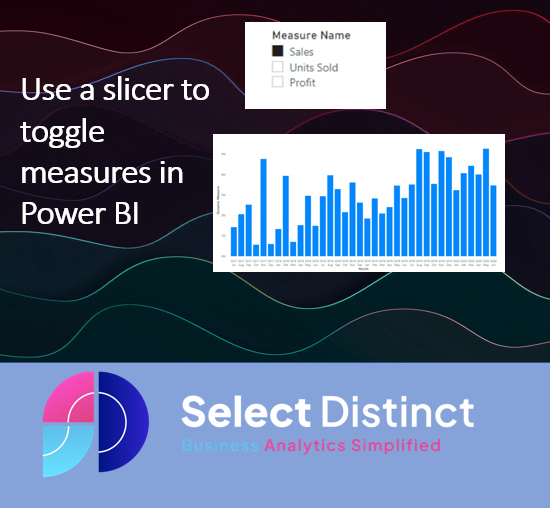
Space on your dashboards is a limiting factor To make the best use of limited space setting up toggle measures in Power BI helps to use the space better One of the key challenges with dashboard building is finding the balance between detail and available space This article shows you how to combine a couple […]
Rolling Averages and Rolling Sums in Power BI

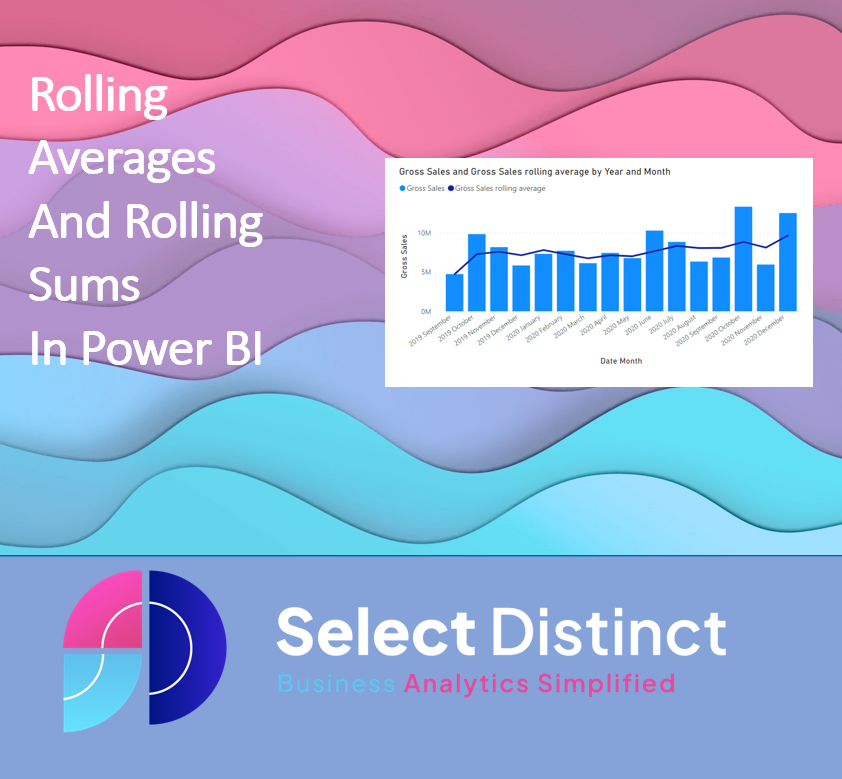
Why are rolling averages useful Rolling averages and Rolling totals are used when analysing data over time Rolling averages smooth out fluctuations across the number of periods Both of these are possible in Power BI if you know the steps involved How to create rolling averages in Power BI Power BI has a really helpful […]
Add a date dimension table in Power BI

How to easily add a date dimension table in Power BI in 1 minute What is a date dimension table A date dimension or calendar dimension is one of the most common tables in a reporting data model. It contains one row per date. It also has all different date attributes and classifications that you […]

