The risks of building AI strategy on sand

#5 The Risks of Building an AI Strategy on Sand – CTO Academy The risks of building an AI strategy on sand Simon Harrison is featured in episode 5 of the CTO Academy podcast In this episode Simon explains some of the things to consider before you throw your data at AI tools Sanjay Mistry […]
Debugging Joins in SQL

Debugging Joins in SQL Joining tables is a powerful feature in SQL that allows you to combine data from multiple tables into a single result set. However, it can sometimes be challenging to get the desired output when working with joins. In this blog post, we will discuss some common issues that arise when debugging […]
TOP N in Power BI
Understanding TOP N in Power BI You have heard of the 80:20 rule (Pareto)? In the world of data analysis, having the ability to efficiently rank and prioritize information is crucial. This is where the TOP N function in Power BI comes into play. By utilizing this powerful ranking function, analysts and data professionals can […]
UNPIVOT Function in SQL
How to Unpivot a Table in SQL Server The Power of the Unpivot function in SQL : How to Convert Columns into Rows in SQL Server with One Simple Operator Have you ever encountered a table that has too many columns and not enough rows? A table that looks like this: This […]
SAMEPERIODLASTYEAR in Power BI
How to Use SAMEPERIODLASTYEAR in Power BI SAMEPERIODLASTYEAR in Power BI is great way to simplify the analysis of year over year performance One of the most common tasks in data analysis is to compare the performance of a business or a process over time. For example, you might want to see how your sales […]
Power BI Drill Through
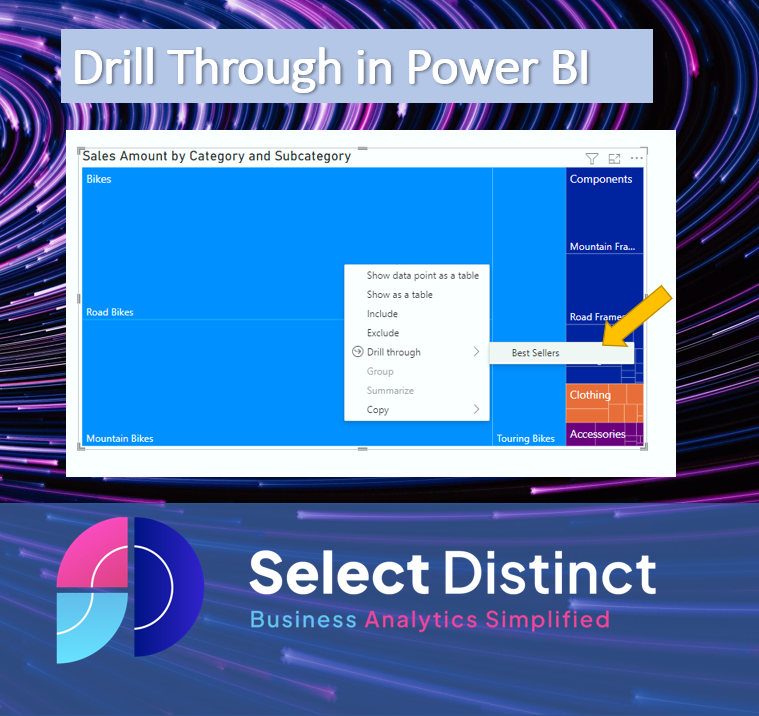
Understanding Drill Through in Power BI and How to Use it to Dig Deeper into Your Data Introduction: What is a Drill Through in Power BI and What Does It Do? Drill Through in Power BI is a powerful feature that allows users to explore their data in greater depth. It enables users to drill […]
PIVOT function in SQL
Introduction to the PIVOT function in SQL The PIVOT function in SQL can be used to create a dataset with aggregated rows from a list of data This post shows you how to transform a table of data like this Into a summary table of data with a column representing each month If you are […]
Toggle Measures in Power BI
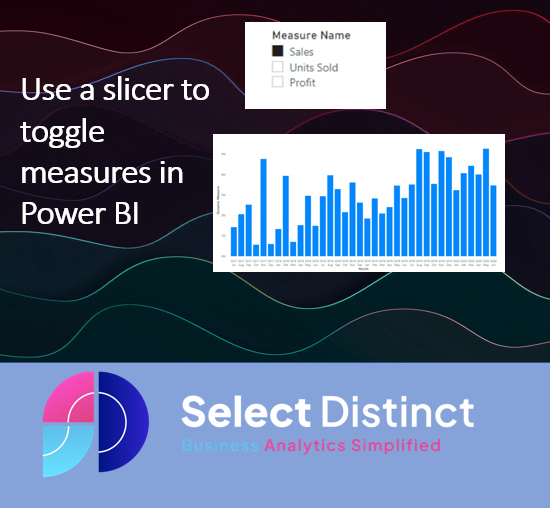
Space on your dashboards is a limiting factor To make the best use of limited space setting up toggle measures in Power BI helps to use the space better One of the key challenges with dashboard building is finding the balance between detail and available space This article shows you how to combine a couple […]
CASE statements in SQL
What are Case Statements in SQL Case statements are a very powerful tool for an analyst Allowing you to add your own dynamic data classification, cleanse and structure data In SQL, CASE statements allow you to check for various conditions and return a value if a condition is met. CASE statements always begin with the […]
Rolling Averages and Rolling Sums in Power BI
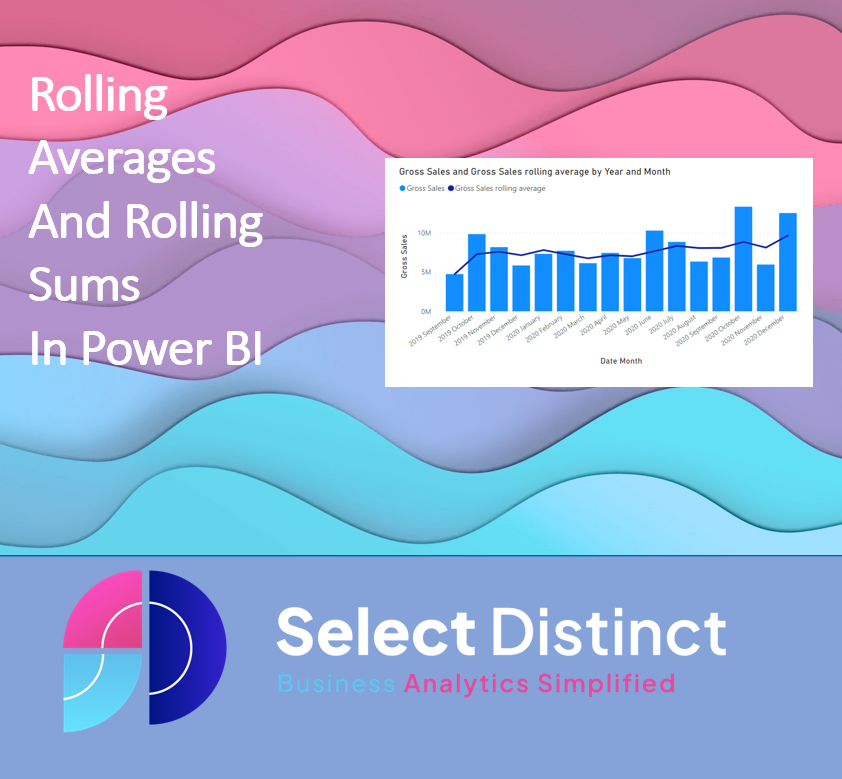
Why are rolling averages useful Rolling averages and Rolling totals are used when analysing data over time Rolling averages smooth out fluctuations across the number of periods Both of these are possible in Power BI if you know the steps involved How to create rolling averages in Power BI Power BI has a really helpful […]