Split a column in BigQuery
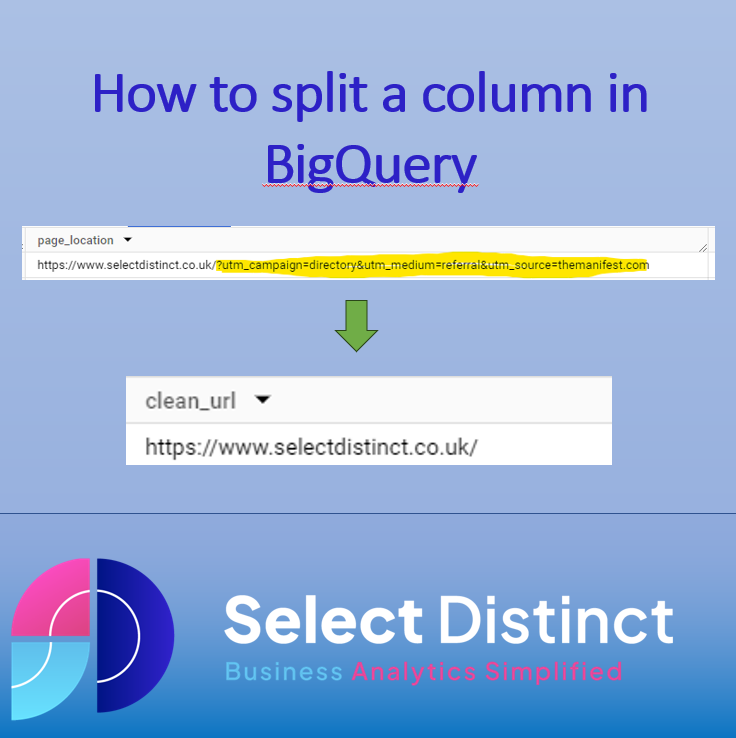
This quick guide shows you how to split a column in BigQuery When working with text data, quite often you need to split a column or trim excess characters to clean the data This quick guide shows you how to do it. Using URL data from Google Analytics GA4 to create separate columns for the […]
Import XML into Excel
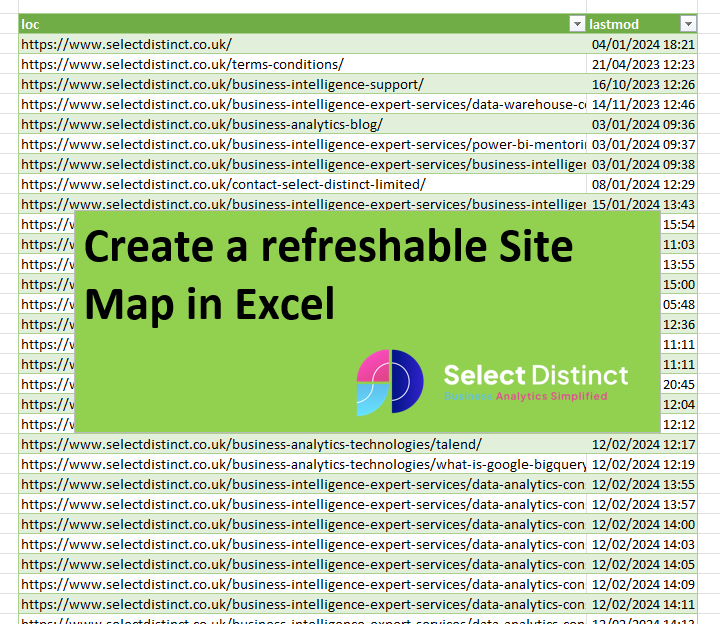
Importing XML data into Excel allows you to have a readily available data source that can be refreshed on Demand Once that data loaded into Excel you can use Excels features to explore, filter, sort or augment that data from other sources What is an XML file? An XML file is a plain text file […]
How to Create Drop Down Lists in Excel
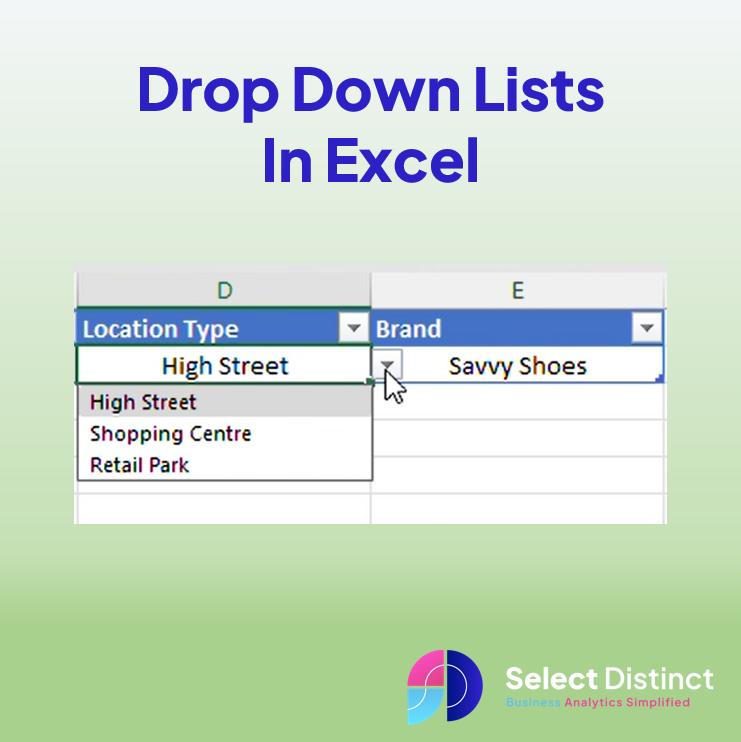
The Drop down list in Excel is a useful feature that allow users to select an item from a list of options. They are commonly used in data entry to control what data is entered. And to ensure that users do not enter incorrect data, preventing some errors This post shows you how to create […]
Top SQL Tips for 2023
Top SQL Tips and Timesavers for 2023 Highlighting our top 5 SQL tips for 2023 based on popularity 1. Our most popular SQL tip this year How to calculate running totals in SQL server why you would use them, and provides a breakdown of the syntax The article gives a step by step example […]
Top Power BI Tips for 2023

Here are our top Power BI tips for 2023 Highlighting our top 5 Power BI tips for 2023 based on popularity Our most popular Power BI tip this year Show values in Rows in Power BI How to show values in rows in the matrix visual in Power BI. a step-by-step guide to change […]
Calculated Columns and Measures in Power BI
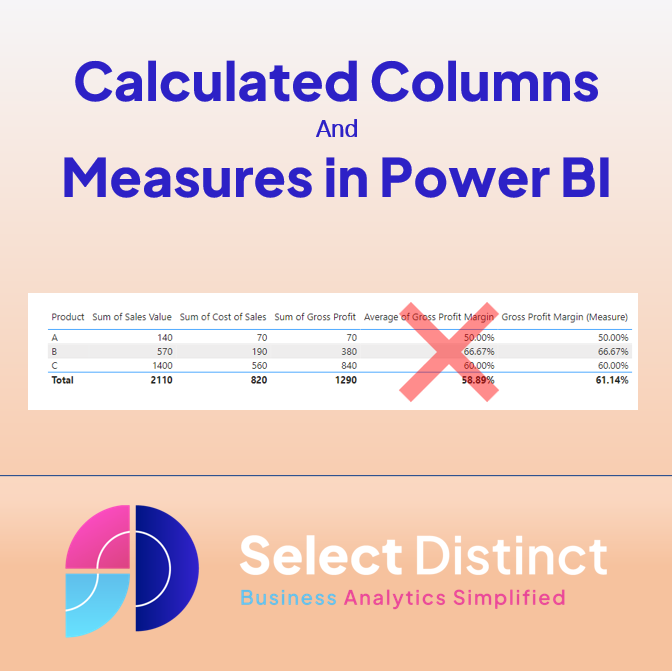
Introduction to Calculated Columns and Measures in Power BI A guide to understanding the differences between calculated columns and measures in DAX for Power BI What is a calculated column? A calculated column is a static value added to a table, calculated row by row when you load the data. What is a measure? A […]
What is Business Analytics
What is Business Analytics? Introduction: What is Business Analytics and why use it? Business analytics refers to the skills, technologies, and practices used to examine the data and performance of an organisation. It aims to generate insights that can help improve business performance and decision-making. Business analytics can help businesses understand their current situation. Predict […]
Divide by Zero Errors
A common error that analysts experience is the divide by zero error This article explains across a range of platforms how to avoid these issues with simple logic to make sure the division by zero errors do not get in the way of analysis We cover how to handle divide by zero errors in SQL […]
When to transform data for Power BI
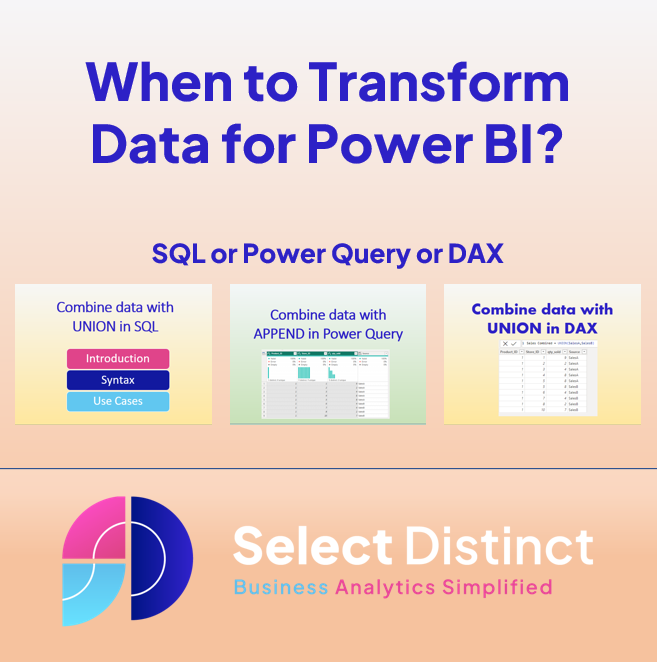
As a general principle we should always look to transform data close to its source to gain efficiencies and minimise potential for discrepancies Over the last few weeks we have shown how data can be combined from multiple sources in three different ways UNION in SQL APPEND data in Power Query UNION in DAX A […]
Power BI KPIs

Power BI KPIs – an overview Power BI KPIs can be a very powerful way to draw attention to specific key performance indicators What is a KPI? a KPI (Key Performance Indicator) is a way to measure performance against a target. These targets can be financial, strategic, operational or simply functional. The important point is […]