(Part 1 of a 2 part post about modelling in Power BI)
If you’ve ever dragged a field into a Power BI visual and wondered whether you’re doing it right—this post is for you.
Understanding the difference between implicit and explicit measures can dramatically improve your report performance, consistency, and flexibility. While these fundamentals are essential for every developer, if you’re looking to scale your enterprise reporting, our Power BI consulting services can help you build a robust, professional-grade data architecture.
In this post we will explain the key differences between implicit and explicit measures in Power BI
We will also explain the “Discourage Implicit Measures” feature and its significance
Understanding Implicit and Explicit Measures
Implicit Measures
What are Implicit measures in Power BI?
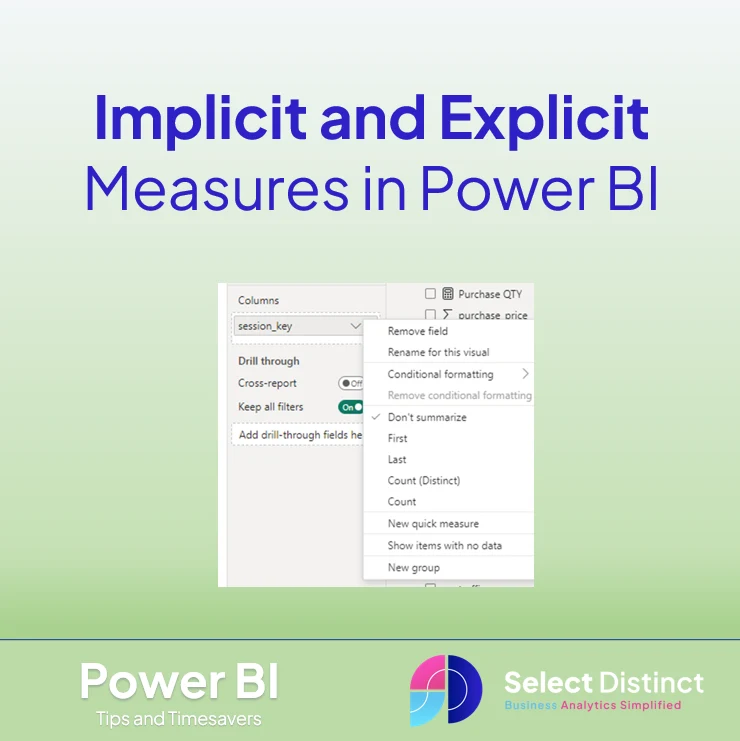
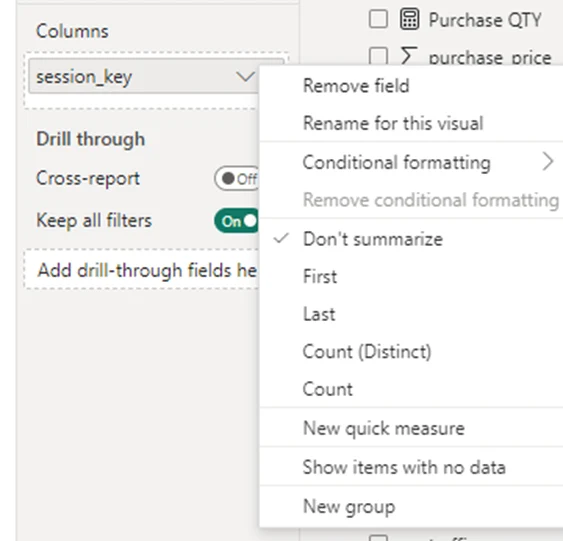
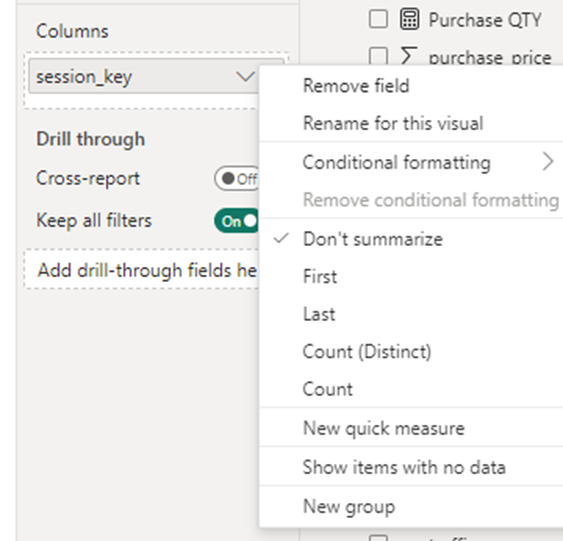
Implicit measures are the measures that are automatically created in Power BI, for example when you drag a field into a visual and you see a list of options to aggregate
In this example we have used a text field so you can see First, Last, Count and Count Distinct options
But you may also use different data types such as numeric fields and see Sum, Average, Maximum and Minimum for example
Important features of Implicit Measures
- Power BI creates these automatically, often correctly assuming the right type of aggregation you may want to use
- Options for aggregation cover the whole range of data ONLY, and include the basic options of sum, average, count and more
- Best for quickly drafting ideas and concepts, require no DAX knowledge and are easy for users to to begin to use
Limitations of Implicit Measures
- The range of aggregations are very limited to basic aggregations, with no way to directly control the results for more advanced analysis, e.g. sales for last week, you can only return the sales value as a whole and would need to use other methods to return prior week, this would require the use of Explicit measures
- The limitations can lead to inconsistencies in more complicated models
Explicit Measures
What is an explicit measure in Power BI?
Explicit measures are where the report developer has used DAX (Data Analysis Expressions) to create a detailed measure value
An example of an Explicit measure would be
Total Impressions = sum(‘Sample GSC Data'[Impressions])
This creates the same type of value that simply dragging the Impressions value filed to the visual and selecting ‘sum’ would have
But the real benefit of explicit measures comes when you can be much more specifc with the measure. This next example shows how to add more DAX code to the measure to create a useful comparative for the same period the year earlier
Impressions LY = CALCULATE(sum(‘Sample GSC Data'[Impressions]), DATEADD(‘Sample GSC Data'[Date],-364,DAY))
Comparing Year on Year in Power BI – Select Distinct
Important features of Explicit Measures
- These are not created automatically, the users write them using DAX formulas
- Options for aggregation are not limited to the standard options, now DAX language can be used to good effect to create powerful measures
- They take a little longer to do as there is the extra step of creating the measure fields, but once created they can be reused
Advantages of Explicit Measures
- The reusability of the measures means that the measures can be consistently applied. for example our impressions LY example could be used on a page that is filtered for a day, week, month or any options of date ranges and it would always return data for the same dates 364 days earlier (provided they are in the data set)
- Far more complex measures can be created, with filters, extra rules and so on. limited only by your DAX knowledge
The Need for Discouraging Implicit Measures
The limitations of implicit measures can lead to a range of undesirable issues with your reports which we wiil expand on here
- Limited Customisation
- Implicit measures are automatically generated by Power BI with basic aggregations like sum, average, count, etc. This limits the ability to customize calculations to fit specific business needs
- Inconsistencies
- Since implicit measures are created on-the-fly, they can lead to inconsistencies across different reports and visualizations. This can make it difficult to maintain a standardized approach to data calculations. Which if you are not careful can lead to users lacking trust in the information
- Complex Calculations
- Implicit measures are not suitable for complex calculations. They lack the flexibility needed to perform advanced data modeling tasks, which can be achieved using explicit measures with DAX (Data Analysis Expressions)
- Reusability
- Implicit measures are tied to specific visualizations and cannot be reused across different reports or datasets. Explicit measures, on the other hand, can be defined once and reused multiple times
- Performance Issues
- Relying heavily on implicit measures can lead to performance issues, especially with large datasets. Explicit measures allow for more optimized and efficient calculations
- Lack of Documentation
- Implicit measures do not provide a clear documentation trail. Explicit measures, defined with DAX, offer better transparency and understanding of the calculations being performed
While implicit measures are convenient for quick and simple calculations, they fall short in scenarios requiring complex, consistent, and reusable calculations. Transitioning to explicit measures can provide greater control, flexibility, and performance in your Power BI reports.
Benefits of Using Explicit Measures
Here will expand on some of the key benefits that adopting explicit measures can bring to your report development in Power BI
- Flexibility and Customization
- Explicit measures allow you to define custom calculations using DAX (Data Analysis Expressions), providing greater flexibility to meet specific business requirements
- You can create complex calculations, apply conditional logic, and use a wide range of DAX functions to achieve the desired results
- Consistency and Reusability
- Explicit measures ensure consistent calculations across different reports and visualizations. Once defined, they can be reused multiple times, promoting efficiency and standardization.
- This reusability helps maintain a clean and efficient data model, reducing the need to recreate similar calculations.
- Enhanced Performance
- By optimizing DAX formulas, explicit measures can improve the performance of your Power BI reports. Users have control over how calculations are performed, allowing for more efficient data processing.
- Explicit measures can be fine-tuned to handle large datasets more effectively, reducing the load on the system.
- Better Documentation and Transparency
- Explicit measures provide a clear documentation trail, making it easier to understand and audit the calculations being performed.
- This transparency is crucial for maintaining data integrity and ensuring that all stakeholders understand the logic behind the numbers.
- Advanced Data Modelling
- Explicit measures are essential for advanced data modeling scenarios. They enable the creation of sophisticated calculations that go beyond basic aggregations.
- This capability is particularly useful for scenarios involving complex business logic, time intelligence, and advanced statistical analysis.
Summary Conclusion
For speed on small and simple reports you can use implicit measures, but once things get complex, large or both consider adopting explicit measures
While implicit measures are convenient for simple, quick calculations, explicit measures offer the control, flexibility, and performance needed for complex data modeling. By leveraging explicit measures, you can create more robust and reliable Power BI reports.
The ‘Discourage Implicit Measures’ feature
Power BI has a setting which can help in the adoption of explicit measures to aid in the adoption of good practice
We recently had a client who was really frustrated that one of their power bi pbix files would not allow them to select certain fields into a card, and they had also noticed that the options for aggregation were no longer available.
“Why can I only use measures on a card?” was the question I was asked
When I looked at the report I realised that this feature had been enabled, the client was forced to create measures for any values he wanted to use on a card or KPI visual that required a single value
The setting had been enabled to discourage the use of implicit measures
How To enable the Discourage Implicit Measures feature
Go to the model view
Expand the properties and data panels on the right
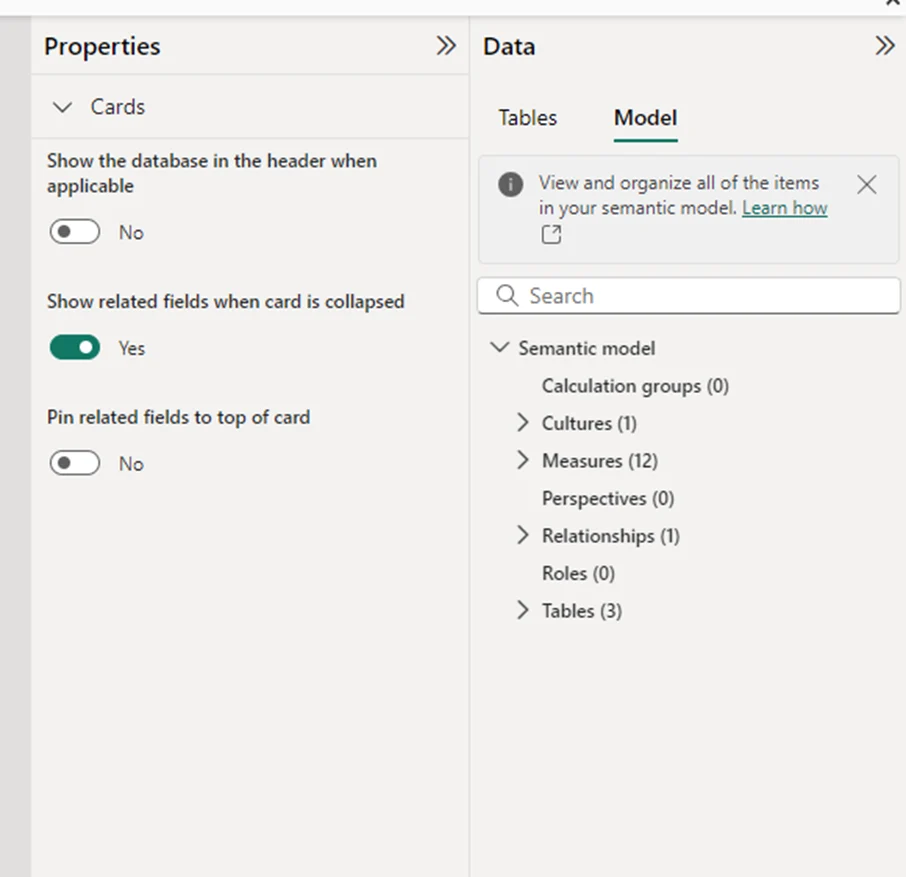
In the data panel, click on semantic model
then in the properties panel, uncheck the discourage implicit measures option
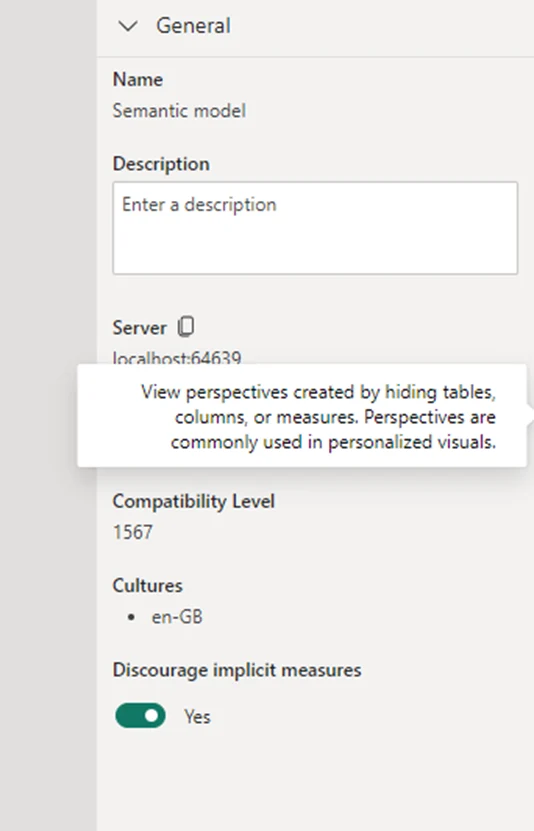
We unchecked this above option and the options for aggregation re-appeared when a field is dragged to a card type visual
Please note: this setting is automatically applied if you are using calculation groups
Real World Benefits of adopting Explicit Measures in Power BI
You have seen some examples of how explicit measures can be used to enforce better reporting disciplines across your reports
In many organisations there are efforts made to centralise and standardise the business calculations, often these are documented rigorously and quality standards checked and enforced
you can find some examples of explicit measures and how to create them here
Comparing Year on Year in Power BI – Select Distinct
SAMEPERIODLASTYEAR in Power BI – Select Distinct Limited
Want to sharpen your Power BI skills?
Subscribe to our YouTube Channel for quick tutorials
Explore our Power BI Glossary for clear definitions and How-To Guides for practical tips