Why are rolling averages useful
Rolling averages and Rolling totals are used when analysing data over time
Rolling averages smooth out fluctuations across the number of periods
Both of these are possible in Power BI if you know the steps involved
How to create rolling averages in Power BI
Power BI has a really helpful feature called quick measures
You can use a quick measure to create a rolling average in Power BI
Quick measures are a commonly used set of calculations, which simplify the DAX coding when you need to create some of the more complex measures. They are also a great way of learning DAX coding
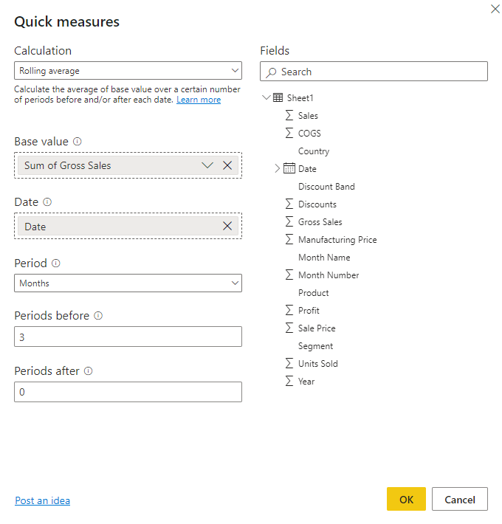
Click on the Quick measures icon
In calculations, scroll down to
‘Rolling Average’
Add the value to measure and the date
Then in periods, set your period interval from days, months quarters or years
Then set the number of periods before and after
Click OK
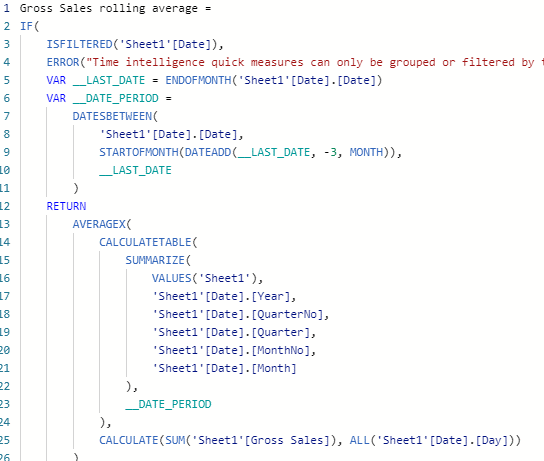
After you click ok the DAX code is generated for you and the new measure is created
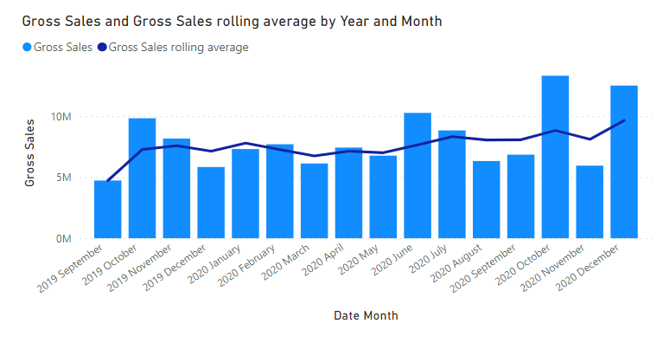
You can now use this field on your visuals
How to create rolling sums in Power BI
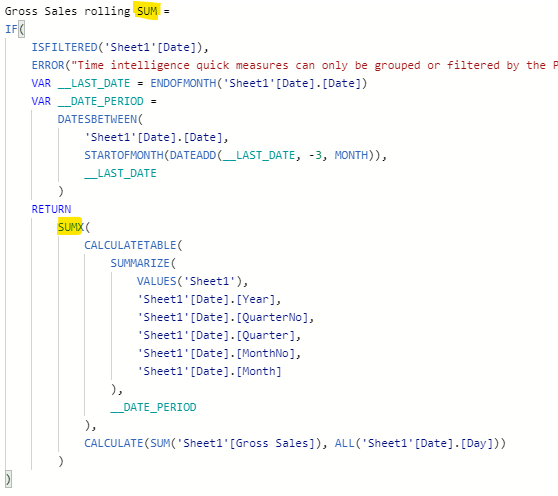
By default, Power BI does not have a quick measure for the rolling sum, but to save time, just create a rolling average, then edit the DAX code
Change the highlighted fields
The first one is the name of the measure, so change it from Average to Sum
The second one needs to change the AVERAGEX function to use a SUMX
The press enter
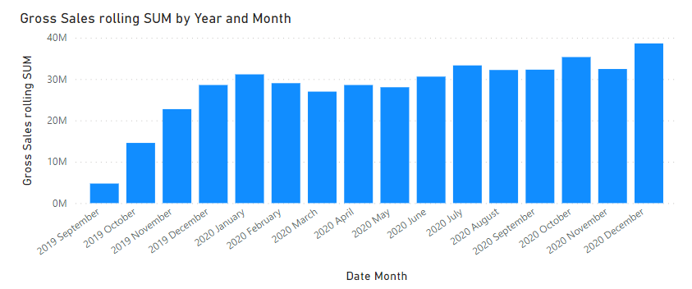
You now have a rolling SUM measure in Power BI
A word of caution though, you can see on the chart that the first periods don’t contain the three periods, so you may need to exclude those from the chart
Conclusion
Having the ability to add a rolling average or rolling sum to Power BI reports helps to smooth out fluctuations and present a more stable result set
Subscribe to our channel to see more tips and timesavers
Select Distinct YouTube Channel
Or find other useful SQL, Power BI or other business analytics timesavers in our Blog
Our Business Analytics Timesavers are selected from our day to day analytics consultancy work. They are the everyday things we see that really help analysts, SQL developers, BI Developers and many more people.
Our blog has something for everyone, from tips for improving your SQL skills to posts about BI tools and techniques. We hope that you find these helpful!

