What are the top 10 reasons to use tables in Excel?
Tables in excel are a great way to begin to add data structure, improving consistency and reliability of the data
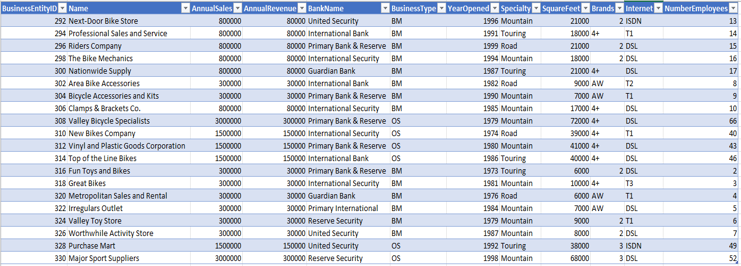
What are Tables in Excel?
The Excel table is a powerful feature that lets you sort, organize, and analyse a set of data. It adds extra controls over that data and helps it not only be more organised but look more organised too
Having tables instead of lots of separate named ranges helps as files get bigger and it gets harder to find or follow where the data is coming from
Here are our top 10 reasons for using tables in Excel
Improved Control over formatting
Using built in table formatting features you can control formats that grow with your table
if you add more data to your excel table, the format is extended to include the new data
Banded Rows for better visibility
By default excel sets the rows as banded rows, which make it easier to read across the data, but of course you can customise this format
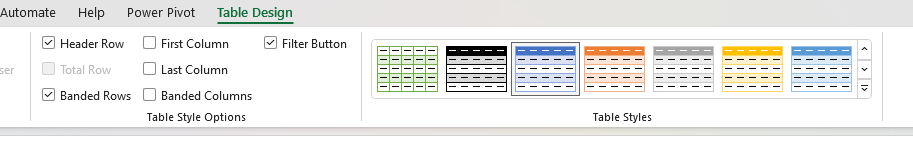
After you have created a table, selecting any part of the table enables the ‘Table Design’ tab to appear on the ribbon.
From there you can customise colours, apply banded rows or columns or both and select from a wide range of table styles
Improved data validation
Excel tables have better integration to the data validation functions
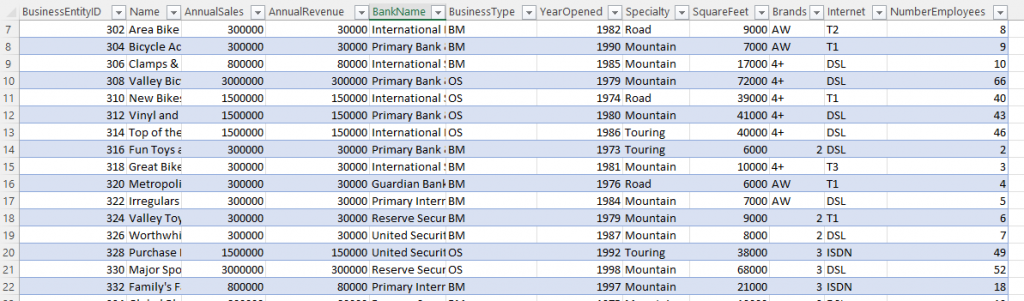
Headers remain visible when you scroll down
As you scroll down a large excel table the headers remain visible at the top of the screen. This saves having to set freeze pane options
Filters are added automatically to each column
Each column instantly has filters which you can use to search or sort the data safe in the knowledge that the integrity of the table will remain as whole rows are sorted together
Tables automatically have a named range, which grow with new data
This is useful if you are subsequently using this full data set for further analysis, as you don’t need to worry about the data range growing, Excel tables have that covered
You can use field names in formulae in Excel Tables
Using field names in formulae is a useful way to make your formulae a lot easier to read
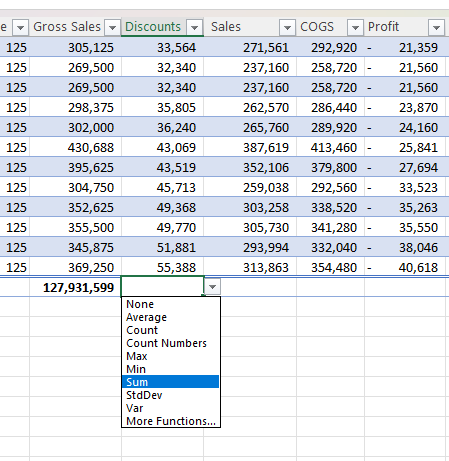
You can add a subtotal row
A subtotal row is convenient, especially when it is filter aware
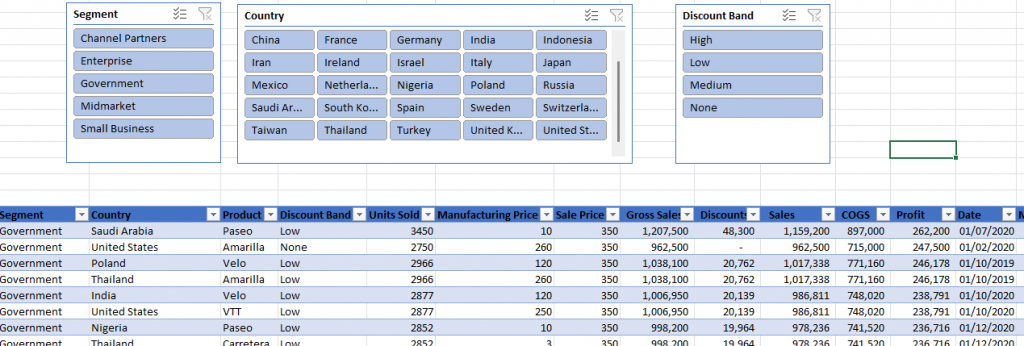
You can use slicers with Excel tables
Slicers connected to tables really simplify filtering of data sets, you can visually see at a glance what options are available for field and whether they are selected
Tables can be renamed, making things a lot easier to find
If tables are carefully named this can be really useful, applying a logical naming convention to tables makes it a lot easier to understand what a complex formula is doing as it makes it a lot more readable
How to create a table in Excel
It is easy to make tables in Excel,
Select the data range that you want to be converted to a table
Press Ctrl +T
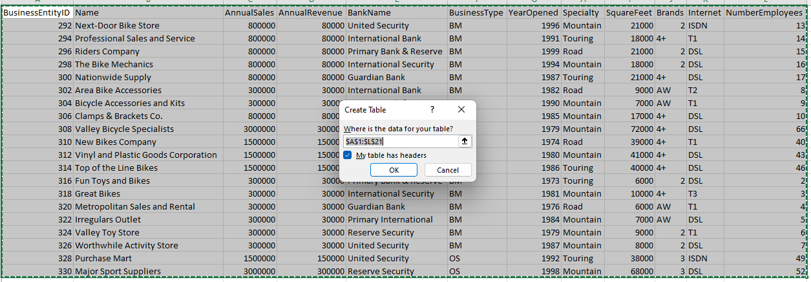
If your data includes headers, tick the box and click OK
and that is it.
You now know how to create tables in Excel and the top 10 reasons to use tables in Excel?
Here is a short presentation of these key points
Subscribe to our channel to see more Excel Tips and Timesavers
Select Distinct YouTube Channel
Our Business Analytics Timesavers are selected from our day to day analytics consultancy work. They are the everyday things we see that really help analysts, SQL developers, BI Developers and many more people.
Our blog has something for everyone, from tips for improving your SQL skills to posts about BI tools and techniques. We hope that you find these helpful!