How to easily add a date dimension table in Power BI in 1 minute
What is a date dimension table
A date dimension or calendar dimension is one of the most common tables in a reporting data model.
It contains one row per date. It also has all different date attributes and classifications that you can customise to suit your needs
A date dimension table allows you to work with dates more easily. Having a date dimension table can eliminate the need for many complex DAX expressions.
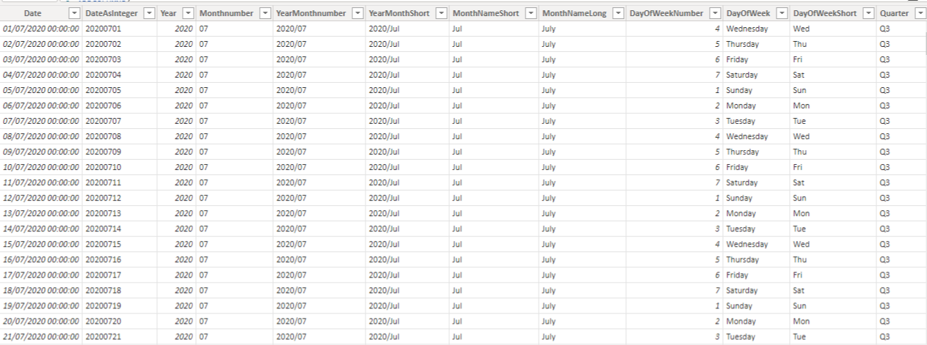
Here is an example of a date dimension table
You can see that there is one row per date, and then for each date a column with the most common values that you would associate with each date
Examples of these are Year, Month Number, Day of the week, Quarter, Month Names and so on
What benefits does a date dimension table have
After you have created a date dimension table you can set a relationship to a key date field in one of your other tables e,g, Sales data. If you relate the sales date to the date dimension you can immediately begin to analyse the sales data using any of the fields in the data dimension
Because you will be using a consistent set of date groupings you will get consistent analysis across reports if you use the same data structure
Perhaps the best benefit is that you can tailor the date dimension table for your organisation or locale, adding in your public holidays etc
Script to create a date dimension in Power BI
Creating a date dimension table in Power BI is straightforward, you can just copy this DAX code into a new table, then customize as needed.
Calendar table =

ADDCOLUMNS(
CALENDAR(DATE( 2020, 1, 1 ), DATE( 2021, 12, 31 ) ), "DateAsInteger", FORMAT ( [Date], "YYYYMMDD" ),
"Year", YEAR( [Date] ),
"Monthnumber", FORMAT ( [Date], "MM" ),
"YearMonthnumber", FORMAT ( [Date], "YYYY/MM" ),
"YearMonthShort", FORMAT ( [Date], "YYYY/mmm" ),
"MonthNameShort", FORMAT ( [Date], "mmm" ),
"MonthNameLong", FORMAT ( [Date], "mmmm" ),
"DayOfWeekNumber", WEEKDAY ( [Date] ),
"DayOfWeek", FORMAT ( [Date], "dddd" ),
"DayOfWeekShort", FORMAT ( [Date], "ddd" ),
"Quarter", "Q" & FORMAT ( [Date], "Q" ),
"YearQuarter", FORMAT ( [Date], "YYYY" ) & "/Q" & FORMAT ( [Date], "Q" ) )
How this works
The CALENDAR function above generates a list of all of the dates between the two date values entered, which you easily customise or substitute for a dynamic date range which references another dataset, we often use this with a maximum and minimum date from a fact table to make the date dimension fully dynamic
Conclusion
Once you have added the date dimension table you can set the relationships to it and use any of the extra date fields in your dashboards
Having the ability to set a relationship in your data model to this table can save a lot of complexity and make your report development a lot easier
Try out different options and see what works best for you.
Watch the video to see it in action, its only just over 1 minute long
Related Topics
Now that you can create a date dimension in Power BI, it would be worth taking a look at
How to sort dates in Power BI
This builds upon this content. It shows you have to sort dates chronologically and improve the appearance of your date based reporting
Subscribe to our channel to see more Power BI Timesavers
Select Distinct YouTube Channel
Our Business Analytics How To Guides are selected from our day to day analytics consultancy work. They are the everyday things we see that really help analysts, SQL developers, BI Developers and many more people.
Our blog has something for everyone, from tips for improving your SQL skills to posts about BI tools and techniques. We hope that you find these helpful!


